Housing market research
We refresh three datasets across the 100 largest US metro areas every month and publish all of it. Reporters, researchers and anyone else are welcome to use it. It is free, it needs no permission, and a link back is the only thing we ask.
Market figures cover August 2026 and were last refreshed on September 17, 2026. Ownership cost figures are American Community Survey 5-year estimates averaging 2019 to 2023.
What the data shows
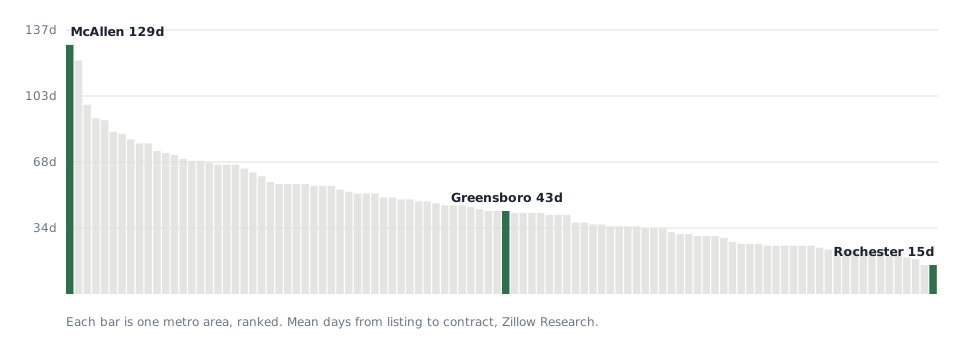
- Slowest market to sell
- 130 days
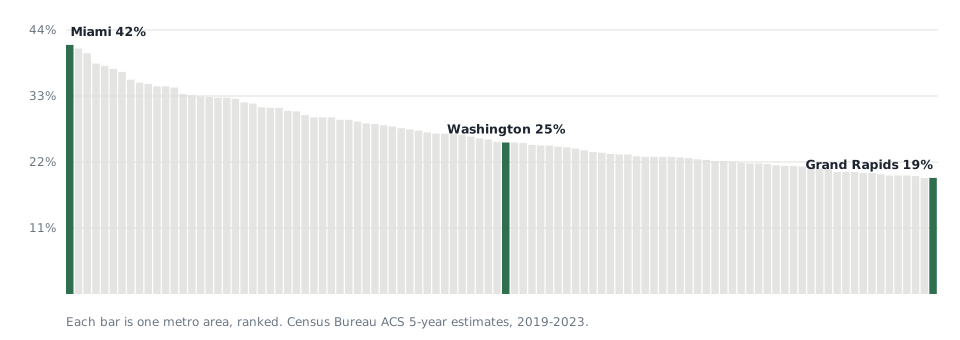
- Most stretched owners
- 41.6%
- Loosest market
- 13.4 months
- Sales below asking
- 50.0%
McAllen, TX, vs 17 days in Rochester
Miami, FL spend 30%+ of income on housing
of supply in McAllen, against 1.8 in Rochester
Nationally, of completed sales
The three datasets
How long a sale takes across 100 metros. We measure days from listing to going under contract, plus a stated estimate for the closing window. The national average is 53 days. The gap between the slowest and fastest market is 113 days, so a national average is close to useless for planning a sale.
What it costs to keep a home across 100 metros. It covers total monthly ownership cost, median property taxes, and the share of mortgaged owners above the 30% cost-burden line. That share runs from 19.4% to 41.6%.
Market conditions per metro and per state. It covers typical home value and its direction, for-sale inventory, new listings, monthly sales, months of supply, the share of listings cutting price, and the share of sales closing below asking.
Methodology
Two things are worth knowing before you quote any of it. Both are places where housing data is often misread.
- Two different vintages. The market figures come from Zillow Research and are monthly, currently August 2026. The ownership cost figures come from the Census Bureau’s ACS 5-year file and average 2019 to 2023. They are not the same kind of number. Do not quote them as if they describe the same moment.
- Each metric carries its own period. Zillow does not publish every file on the same schedule. The share of sales closing below asking currently covers July 2026, a month behind the rest.
- Months of supply is derived, not published. We calculate it as for-sale inventory divided by that month’s sales count, both from Zillow. It is the standard method, but the calculation is ours, not theirs.
- Cost burden is the federal convention. It means housing costs above 30% of household income, the line HUD and the Census Bureau use. The data comes from ACS tables B25088, B25091 and B25103. Monthly cost is the full cost of ownership, including taxes, insurance and utilities, not the loan payment.
- Metro means CBSA. Figures cover the whole statistical area, not the city limits. The Chattanooga figures include the Georgia counties in that metro.
We do not adjust, smooth or reweight any of it. Where a figure is an estimate rather than a measurement, the page that shows it says so.
Using this
Take it. You need no permission, and we ask for no credit beyond a link. You are welcome to rebuild a chart in your own house style. If it is useful, use it.
Suggested citation
Nikita Buys Houses, "Housing Market Research", August 2026 data, https://nikitabuyshouses.com/research
These are the underlying sources. Where a figure is theirs rather than ours, cite them alongside us or instead of us: Zillow Research and the US Census Bureau American Community Survey.
You may want a cut of the data we have not published, a figure for a market not in the largest 100, or to know how something was derived. If so, get in touch and say it is a press question. Nikita answers those himself.
Who publishes this
Nikita Buys Houses is a cash home-buying company run by Nikita Levitan and Sabrina Gao. We buy houses in all fifty states. That is why we track these markets in the first place: we use this data to run the business before we publish it.
That is a commercial interest, and it is worth stating plainly. It does not touch the numbers, which come from public files anybody can download and check. But you should know it before you quote us. More on who we are.