How long it takes to sell a house, by metro
Every one of the 100 largest US metro markets, ranked by how long a house actually takes to go under contract. The national average is 53 days, but that average hides a spread of more than 113 days between the slowest market and the fastest.
Zillow Research data covering August 2026. Days to contract is measured. The closing window of 30 to 45 days is an estimate, because no public dataset reports it.
- Slowest market
- 130 days
- Median of the 100
- 46 days
- Fastest market
- 17 days
McAllen, TX
Ogden, UT sits at the midpoint
Rochester, NY
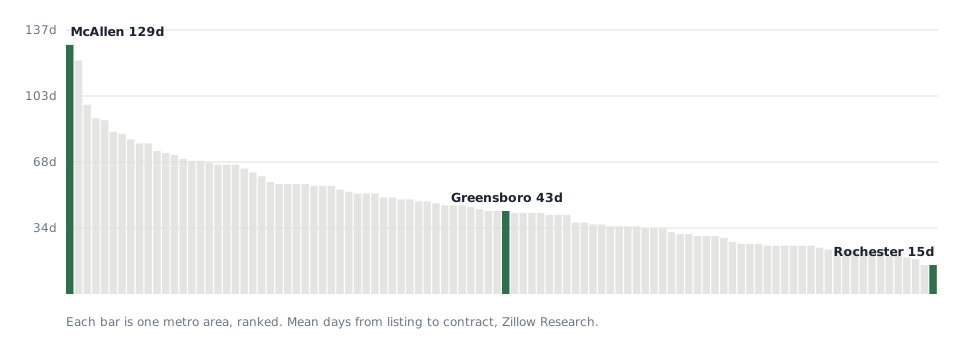
Every market, slowest first
Days to contract is the time from listing until an offer is accepted, not until the money arrives. The total column adds the 30 to 45 days a financed buyer needs to close, and still excludes whatever time goes into getting the house ready to list.
| Market | To contract | Realistic total | Months of supply | Cutting price |
|---|---|---|---|---|
| McAllen, TX | 130 days | 160 to 175 | 13.4 | 18.1% |
| Cape Coral, FL | 119 days | 149 to 164 | 7.5 | 21.2% |
| Miami, FL | 98 days | 128 to 143 | 7.0 | 18.9% |
| North Port, FL | 91 days | 121 to 136 | 5.4 | 24.9% |
| Deltona, FL | 89 days | 119 to 134 | 5.0 | 27.2% |
| New Orleans, LA | 87 days | 117 to 132 | 5.7 | 25.4% |
| San Antonio, TX | 82 days | 112 to 127 | 8.2 | 30.5% |
| Austin, TX | 82 days | 112 to 127 | 7.7 | 30.2% |
| Jacksonville, FL | 80 days | 110 to 125 | 5.0 | 28.4% |
| Lakeland, FL | 80 days | 110 to 125 | 6.2 | 26.8% |
| Charleston, SC | 79 days | 109 to 124 | 5.2 | 27.3% |
| Houston, TX | 74 days | 104 to 119 | 7.1 | 29.5% |
| El Paso, TX | 73 days | 103 to 118 | 5.6 | 16.6% |
| Baton Rouge, LA | 71 days | 101 to 116 | 4.6 | 27.0% |
| Tampa, FL | 70 days | 100 to 115 | 5.2 | 31.2% |
| Orlando, FL | 70 days | 100 to 115 | 5.9 | 28.0% |
| Honolulu, HI | 70 days | 100 to 115 | 5.4 | 19.4% |
| Atlanta, GA | 69 days | 99 to 114 | 5.0 | 30.5% |
| Tucson, AZ | 67 days | 97 to 112 | 4.7 | 27.6% |
| Little Rock, AR | 67 days | 97 to 112 | 5.1 | 24.3% |
| Palm Bay, FL | 67 days | 97 to 112 | 4.3 | 28.8% |
| Phoenix, AZ | 63 days | 93 to 108 | 4.7 | 31.8% |
| Las Vegas, NV | 63 days | 93 to 108 | 5.7 | 29.7% |
| Dallas, TX | 61 days | 91 to 106 | 6.0 | 34.3% |
| Memphis, TN | 61 days | 91 to 106 | 4.3 | 29.8% |
| Chattanooga, TN | 61 days | 91 to 106 | 4.3 | 33.1% |
| Nashville, TN | 60 days | 90 to 105 | 4.4 | 33.7% |
| Oklahoma City, OK | 59 days | 89 to 104 | 4.6 | 29.7% |
| Augusta, GA | 59 days | 89 to 104 | 4.2 | 28.0% |
| Riverside, CA | 58 days | 88 to 103 | 4.8 | 23.5% |
| Charlotte, NC | 58 days | 88 to 103 | 4.6 | 29.5% |
| Greenville, SC | 57 days | 87 to 102 | 3.8 | 32.1% |
| Jackson, MS | 57 days | 87 to 102 | 5.7 | 24.4% |
| New York, NY | 55 days | 85 to 100 | 3.3 | 16.0% |
| Tulsa, OK | 54 days | 84 to 99 | 3.6 | 29.2% |
| Durham, NC | 54 days | 84 to 99 | 3.9 | 33.1% |
| Bakersfield, CA | 53 days | 83 to 98 | 4.8 | 23.6% |
| Columbia, SC | 53 days | 83 to 98 | 3.8 | 33.0% |
| Des Moines, IA | 52 days | 82 to 97 | 4.2 | 31.9% |
| Provo, UT | 52 days | 82 to 97 | 5.0 | 36.1% |
| Raleigh, NC | 51 days | 81 to 96 | 3.9 | 36.3% |
| Knoxville, TN | 51 days | 81 to 96 | 3.7 | 31.6% |
| Colorado Springs, CO | 50 days | 80 to 95 | 5.6 | 37.9% |
| Spokane, WA | 50 days | 80 to 95 | 4.5 | 29.6% |
| Birmingham, AL | 49 days | 79 to 94 | 3.6 | 25.1% |
| Los Angeles, CA | 48 days | 78 to 93 | 4.2 | 23.5% |
| Denver, CO | 48 days | 78 to 93 | 4.9 | 36.0% |
| Winston-Salem, NC | 47 days | 77 to 92 | 3.3 | 31.0% |
| Virginia Beach, VA | 46 days | 76 to 91 | 3.1 | 24.7% |
| Oxnard, CA | 46 days | 76 to 91 | 3.6 | 27.8% |
| Ogden, UT | 46 days | 76 to 91 | 4.1 | 36.2% |
| Portland, OR | 45 days | 75 to 90 | 4.2 | 30.8% |
| Salt Lake City, UT | 45 days | 75 to 90 | 3.6 | 36.3% |
| Greensboro, NC | 44 days | 74 to 89 | 3.4 | 29.3% |
| Stockton, CA | 44 days | 74 to 89 | 3.3 | 28.3% |
| Fresno, CA | 43 days | 73 to 88 | 3.5 | 24.0% |
| San Diego, CA | 42 days | 72 to 87 | 3.8 | 27.8% |
| Wichita, KS | 42 days | 72 to 87 | 3.0 | 22.3% |
| Sacramento, CA | 41 days | 71 to 86 | 3.4 | 29.0% |
| Seattle, WA | 39 days | 69 to 84 | 4.2 | 32.7% |
| Minneapolis, MN | 39 days | 69 to 84 | 2.8 | 27.4% |
| San Francisco, CA | 38 days | 68 to 83 | 2.9 | 20.7% |
| Albuquerque, NM | 38 days | 68 to 83 | 3.9 | 30.8% |
| Pittsburgh, PA | 37 days | 67 to 82 | 2.9 | 29.1% |
| Indianapolis, IN | 37 days | 67 to 82 | 3.3 | 34.5% |
| San Jose, CA | 37 days | 67 to 82 | 2.9 | 22.4% |
| Louisville, KY | 37 days | 67 to 82 | 3.2 | 32.1% |
| Scranton, PA | 37 days | 67 to 82 | 2.4 | 24.1% |
| Modesto, CA | 37 days | 67 to 82 | 3.0 | 24.9% |
| Washington, DC | 35 days | 65 to 80 | 3.2 | 28.2% |
| Madison, WI | 35 days | 65 to 80 | 2.7 | 25.2% |
| Boise, ID | 34 days | 64 to 79 | 2.8 | 31.5% |
| Milwaukee, WI | 33 days | 63 to 78 | 2.8 | 18.1% |
| Detroit, MI | 32 days | 62 to 77 | 2.8 | 27.8% |
| Baltimore, MD | 32 days | 62 to 77 | 2.9 | 28.7% |
| Philadelphia, PA | 31 days | 61 to 76 | 2.5 | 25.0% |
| Bridgeport, CT | 30 days | 60 to 75 | 2.6 | 18.8% |
| Chicago, IL | 29 days | 59 to 74 | 2.5 | 25.4% |
| Boston, MA | 29 days | 59 to 74 | 2.7 | 22.9% |
| Providence, RI | 29 days | 59 to 74 | 2.7 | 22.1% |
| Worcester, MA | 29 days | 59 to 74 | 2.5 | 25.6% |
| Omaha, NE | 29 days | 59 to 74 | 2.8 | 30.2% |
| Cincinnati, OH | 27 days | 57 to 72 | 2.4 | 31.0% |
| Kansas City, MO | 27 days | 57 to 72 | 2.7 | 29.8% |
| Columbus, OH | 27 days | 57 to 72 | 2.9 | 33.9% |
| St. Louis, MO | 26 days | 56 to 71 | 2.4 | 27.1% |
| Cleveland, OH | 26 days | 56 to 71 | 2.7 | 24.5% |
| Richmond, VA | 26 days | 56 to 71 | 2.5 | 28.4% |
| Springfield, MA | 26 days | 56 to 71 | 2.3 | 22.5% |
| Toledo, OH | 26 days | 56 to 71 | 2.4 | 22.4% |
| New Haven, CT | 25 days | 55 to 70 | 2.5 | 23.0% |
| Akron, OH | 24 days | 54 to 69 | 2.5 | 23.3% |
| Harrisburg, PA | 24 days | 54 to 69 | 2.0 | 26.9% |
| Buffalo, NY | 23 days | 53 to 68 | 2.3 | 21.6% |
| Allentown, PA | 23 days | 53 to 68 | 2.2 | 21.1% |
| Grand Rapids, MI | 22 days | 52 to 67 | 2.0 | 28.7% |
| Albany, NY | 21 days | 51 to 66 | 2.5 | 23.0% |
| Syracuse, NY | 20 days | 50 to 65 | 2.1 | 18.8% |
| Hartford, CT | 17 days | 47 to 62 | 1.9 | 17.8% |
| Rochester, NY | 17 days | 47 to 62 | 1.8 | 14.9% |
Each market links to a full breakdown of its timeline. To see how we buy in a given market, follow through to its location page.
Why the spread is this wide
A house in Rochester goes under contract in about 17 days. The same house in McAllen takes about 130 days. That gap is not about the houses. It is about how much choice buyers have, and how much of the standing inventory a month of sales actually clears.
That is why a national average is close to useless for planning a sale. If you are deciding whether to list or take a cash offer, the only timeline that matters is the one in your own market, applied to a house in your own condition. A property needing visible work sits well past these averages in any market, because it is the first thing a buyer with options passes over.
We buy houses for cash in all 100 of these markets and in every US state. Where listing would clearly net you more, we say so: the comparison against listing with an agent keeps its losing row on purpose.
Tell us what you need for the house
You do not need a number ready, or photos, or a plan. Want to know your real options, even the ones that do not involve us? Call and ask.

Sabrina usually picks up. (615) 576-8827