What it costs to own a home, by metro
Every one of the 100 largest US metro markets, ranked by the share of homeowners with a mortgage who spend more than 30% of their income on housing. It runs from 19.4% in Grand Rapids to 41.6% in Miami, a gap of 22 percentage points between two markets in the same country.
US Census Bureau, American Community Survey 5-year estimates averaging 2019 to 2023. Structural rather than current: these describe what ownership costs here relative to elsewhere, not this month.
- Most stretched
- 41.6%
- Median of the 100
- 25.3%
- Least stretched
- 19.4%
- Dearest to keep
- $4,001/mo
Miami, FL
Washington, DC sits at the midpoint
Grand Rapids, MI
San Jose, CA
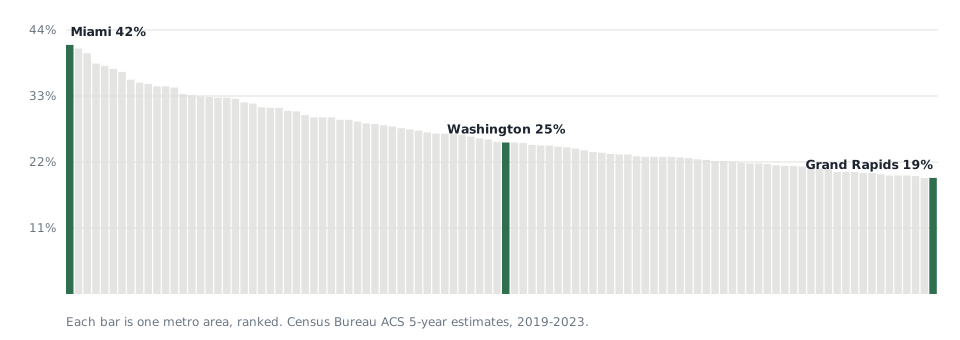
Every market, most stretched first
Monthly cost is the full cost of ownership, not the loan payment: mortgage, property taxes, insurance, utilities and any association fees. The last column is the same figure for households who have paid the mortgage off, and it is the one people are most surprised by.
| Market | Spending 30%+ | Monthly cost | Property tax | No mortgage |
|---|---|---|---|---|
| Miami, FL | 41.6% | $2,302 | $3,570 | $809 |
| Los Angeles, CA | 41.0% | $3,143 | $5,621 | $819 |
| Honolulu, HI | 40.2% | $3,066 | $2,482 | $743 |
| San Diego, CA | 38.5% | $3,115 | $5,542 | $826 |
| Riverside, CA | 38.1% | $2,394 | $3,784 | $683 |
| Oxnard, CA | 37.6% | $3,045 | $5,326 | $796 |
| New York, NY | 37.1% | $3,232 | $9,937 | $1,297 |
| Modesto, CA | 35.8% | $2,101 | $3,025 | $669 |
| Bakersfield, CA | 35.3% | $1,901 | $2,833 | $599 |
| San Francisco, CA | 35.1% | $3,839 | $8,156 | $986 |
| Bridgeport, CT | 34.7% | $3,196 | $8,937 | $1,321 |
| Cape Coral, FL | 34.7% | $1,803 | $2,699 | $706 |
| Stockton, CA | 34.5% | $2,376 | $3,782 | $694 |
| Deltona, FL | 33.4% | $1,598 | $2,290 | $591 |
| Fresno, CA | 33.2% | $1,976 | $2,685 | $629 |
| North Port, FL | 33.0% | $1,916 | $2,836 | $690 |
| Lakeland, FL | 32.9% | $1,609 | $1,769 | $511 |
| Sacramento, CA | 32.8% | $2,533 | $4,254 | $755 |
| San Jose, CA | 32.8% | $4,001 | $9,554 | $1,072 |
| El Paso, TX | 32.6% | $1,561 | $3,481 | $530 |
| New Orleans, LA | 32.0% | $1,750 | $1,473 | $533 |
| Orlando, FL | 31.8% | $1,877 | $2,592 | $617 |
| Las Vegas, NV | 31.2% | $1,858 | $1,990 | $523 |
| Tampa, FL | 31.1% | $1,813 | $2,385 | $591 |
| McAllen, TX | 31.1% | $1,413 | $2,187 | $459 |
| Springfield, MA | 30.6% | $1,904 | $4,332 | $792 |
| Palm Bay, FL | 30.5% | $1,700 | $2,139 | $566 |
| New Haven, CT | 29.9% | $2,342 | $6,676 | $1,078 |
| Boston, MA | 29.5% | $2,906 | $6,696 | $1,110 |
| Providence, RI | 29.5% | $2,238 | $4,793 | $868 |
| Colorado Springs, CO | 29.5% | $2,025 | $1,762 | $585 |
| Seattle, WA | 29.1% | $2,796 | $5,832 | $945 |
| Virginia Beach, VA | 29.1% | $1,943 | $2,652 | $644 |
| San Antonio, TX | 28.8% | $1,907 | $4,331 | $623 |
| Portland, OR | 28.5% | $2,333 | $4,643 | $778 |
| Chicago, IL | 28.4% | $2,179 | $6,266 | $884 |
| Dallas, TX | 28.2% | $2,280 | $5,589 | $819 |
| Houston, TX | 28.0% | $2,147 | $4,713 | $731 |
| Denver, CO | 27.7% | $2,414 | $2,873 | $688 |
| Albuquerque, NM | 27.5% | $1,553 | $2,352 | $495 |
| Worcester, MA | 27.3% | $2,326 | $5,207 | $914 |
| Spokane, WA | 27.0% | $1,764 | $3,071 | $590 |
| Austin, TX | 26.8% | $2,392 | $6,973 | $912 |
| Jacksonville, FL | 26.8% | $1,765 | $2,401 | $563 |
| Tucson, AZ | 26.7% | $1,595 | $2,248 | $542 |
| Hartford, CT | 26.6% | $2,264 | $6,378 | $1,008 |
| Philadelphia, PA | 26.3% | $2,144 | $4,993 | $811 |
| Charleston, SC | 26.0% | $1,834 | $1,651 | $541 |
| Memphis, TN | 25.8% | $1,590 | $1,856 | $536 |
| Phoenix, AZ | 25.4% | $1,841 | $1,927 | $541 |
| Washington, DC | 25.3% | $2,767 | $5,082 | $875 |
| Jackson, MS | 25.3% | $1,450 | $1,391 | $444 |
| Atlanta, GA | 25.2% | $1,882 | $2,738 | $591 |
| Nashville, TN | 24.9% | $1,814 | $1,976 | $542 |
| Baltimore, MD | 24.8% | $2,204 | $3,833 | $709 |
| Boise, ID | 24.8% | $1,715 | $2,415 | $494 |
| Provo, UT | 24.6% | $2,005 | $2,223 | $539 |
| Allentown, PA | 24.5% | $1,901 | $4,842 | $773 |
| Scranton, PA | 24.3% | $1,449 | $2,664 | $621 |
| Salt Lake City, UT | 24.0% | $2,024 | $2,701 | $574 |
| Columbia, SC | 23.7% | $1,428 | $1,260 | $440 |
| Detroit, MI | 23.6% | $1,678 | $3,292 | $642 |
| Richmond, VA | 23.4% | $1,814 | $2,410 | $571 |
| Baton Rouge, LA | 23.3% | $1,617 | $1,301 | $438 |
| Greensboro, NC | 23.3% | $1,383 | $1,681 | $443 |
| Oklahoma City, OK | 23.0% | $1,619 | $2,053 | $571 |
| Milwaukee, WI | 22.9% | $1,831 | $4,390 | $732 |
| Birmingham, AL | 22.9% | $1,528 | $1,091 | $470 |
| Tulsa, OK | 22.9% | $1,527 | $1,860 | $534 |
| Augusta, GA | 22.9% | $1,448 | $1,336 | $451 |
| Ogden, UT | 22.8% | $1,885 | $2,500 | $543 |
| Rochester, NY | 22.7% | $1,599 | $5,024 | $718 |
| Cleveland, OH | 22.5% | $1,532 | $3,507 | $633 |
| Harrisburg, PA | 22.4% | $1,677 | $3,134 | $647 |
| Minneapolis, MN | 22.2% | $2,069 | $3,833 | $751 |
| Charlotte, NC | 22.2% | $1,694 | $2,205 | $481 |
| Albany, NY | 22.1% | $1,932 | $5,134 | $740 |
| Madison, WI | 21.9% | $2,048 | $5,798 | $826 |
| Winston-Salem, NC | 21.8% | $1,368 | $1,547 | $425 |
| Durham, NC | 21.8% | $1,797 | $2,921 | $593 |
| Louisville, KY | 21.7% | $1,511 | $1,912 | $550 |
| Little Rock, AR | 21.5% | $1,405 | $1,349 | $468 |
| Kansas City, MO | 21.4% | $1,784 | $2,921 | $668 |
| Chattanooga, TN | 21.4% | $1,442 | $1,641 | $473 |
| Knoxville, TN | 21.3% | $1,445 | $1,257 | $449 |
| Greenville, SC | 21.0% | $1,430 | $1,223 | $409 |
| Syracuse, NY | 21.0% | $1,560 | $4,479 | $664 |
| Omaha, NE | 20.9% | $1,823 | $4,181 | $749 |
| St. Louis, MO | 20.4% | $1,628 | $2,828 | $618 |
| Columbus, OH | 20.4% | $1,764 | $3,835 | $688 |
| Buffalo, NY | 20.4% | $1,553 | $4,432 | $641 |
| Toledo, OH | 20.2% | $1,414 | $2,714 | $570 |
| Wichita, KS | 20.2% | $1,543 | $2,406 | $601 |
| Raleigh, NC | 20.0% | $1,902 | $2,712 | $592 |
| Pittsburgh, PA | 19.8% | $1,539 | $2,776 | $590 |
| Akron, OH | 19.8% | $1,459 | $2,944 | $587 |
| Des Moines, IA | 19.8% | $1,734 | $4,195 | $689 |
| Cincinnati, OH | 19.7% | $1,624 | $2,901 | $613 |
| Indianapolis, IN | 19.4% | $1,524 | $2,029 | $557 |
| Grand Rapids, MI | 19.4% | $1,534 | $2,898 | $582 |
How to read this
Cost burden is a ratio, not a price. A market can be cheap in dollars and hard to afford, because it is measured against local incomes rather than against the national ones. Grand Rapids is not on the low end because houses there are cheap; it is there because what people earn and what housing costs are closer together than in Miami.
The 30% line is the threshold HUD and the Census Bureau use to classify a household as cost burdened. It is a convention rather than a cliff, and plenty of households above it are managing while plenty below it are not.
For how long a sale actually takes in each of these markets, see the selling timeline by metro. Nationally, 50.0% of sales close below the asking price.
Figures for August 2026 where market data is used, and ACS 2019 to 2023 for the cost figures. Tables B25088, B25091 and B25103. Covering 100 metro areas.
Talk to us before you decide anything
You do not need a number ready, or photos, or a plan. Want to know your real options, even the ones that do not involve us? Call and ask.

Sabrina usually picks up. (615) 576-8827